
Written By: Terence P. Stewart, Esq.
Law Offices of Stewart and Stewart
Washington, DC
As 2014 begins, the United States is involved in a variety of trade negotiations to try to liberalize trade in various sectors, with various countries, or within the World Trade Organization (“WTO”) more broadly. Economic theory typically applauds such negotiations and certainly much of the business community is supportive of trade liberalization. Some of the trade negotiations are large in potential economic effect:
- The Trans Pacific Partnership (“TPP”) negotiations with eleven other countries is reportedly far advanced with the possibility of closure during 2014 (predictions seen suggest possible closure in the front half of 2014). While some of the initial countries involved were not large economically, the line-up today includes Japan as well as Malaysia, Vietnam, New Zealand, and Brunei in addition to current FTA partners Canada, Mexico, Australia, Chile, Peru, and Singapore. Korea is in discussions with trading partners about possibly joining and others are rumored to be interested, including Indonesia, the Philippines, Taiwan, and Thailand. Even China has made rumblings of potential interest.
- The United States and the European Union have started negotiations on a possible Trans-Atlantic Trade and Investment Partnership (“TTIP”) agreement, although major challenges confront the parties with the topics to be addressed, long-held positions of the two players, externalities (such as the NSA surveillance issues), and timing of political events within the EU (EU Parliamentary elections; new EU Commission). If regulatory convergence were possible in some major areas, such a negotiation would be potentially of significant value to U.S. companies and their workers and their European counterparts. While work will proceed on TTIP in 2014, few expect resolution during the year.
- The Trade in Services Agreement negotiations occurring amongst the willing WTO Members interested in further services liberalization could move into high gear in 2014 and is the broadest current platform for many service sectors interested in trade liberalization.
- The deepening of the Government Procurement Agreement (“GPA”) commitments, again among current WTO GPA Members, will likely occur during the first half of 2014 as enough of the GPA members implement obligations to which they agreed.
- WTO Members agreed at the Bali Ministerial last month to develop a work program in 2014 for completing the remaining portions of the Doha Development Agenda. The Bali Package will see legal scrubbing on the Trade Facilitation Agreement, with adoption of the Agreement likely during the summer.
- And finally, efforts have started in the United States to address the issue of trade promotion authority (“TPA”) for President Obama (and his successor), including what changes in the 2002 TPA legislation are appropriate/needed as well as what other trade law issues need to be included in any legislation – GSP renewal, Trade Adjustment Assistance renewal/revision, miscellaneous tariff provisions, Customs legislation, etc.
2014 looks to be, potentially, a very important year for trade globally and in the United States. Unfortunately for the United States, neither the Obama Administration nor the Congress seem prepared to engage in a searching review of what has or has not happened under the trade policy directions of the last forty years and what modifications are needed either in trade policy or in national legislation to address the ballooning trade deficit in goods.
The failure to explore what has happened, what is and is not working, and what steps might be necessary to achieve better balance in our trade with the world leads major constituencies to stake out starkly opposite positions in the process—large segments of the business community push for trade liberalization under the current model (and often view their obligations to their shareholders without regard to national ties) against the strong opposition of labor, environmental, and public interest groups, who tend to view the trading relationship through the prism of whether American working men and women are benefitting in fact or whether national environmental or other interests are being served.
What has happened in trade since the first TPA legislation in 1974?
The last forty years have seen an explosion of trade, with both imports and exports expanding many fold – 32 times for imports and 22 times for exports. This is potentially good news from an economic perspective as such expanded trade permits companies to focus on areas of competitive advantage and for consumers to benefit from greater choice and potentially more competitive goods.
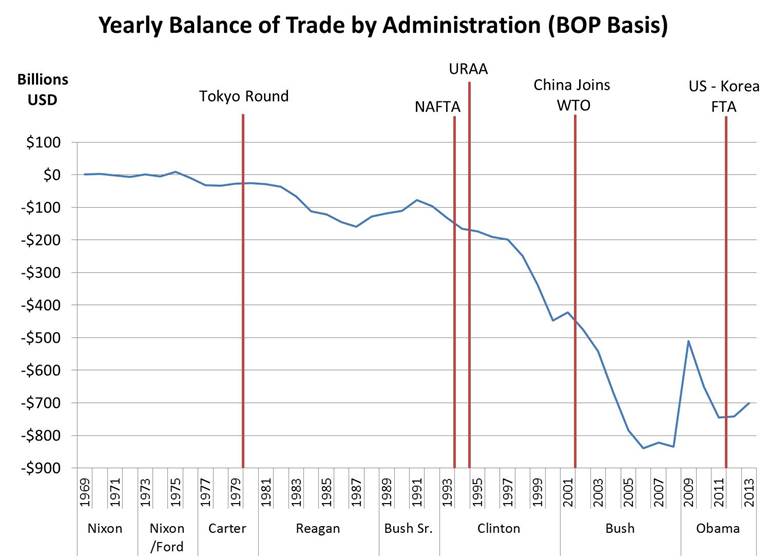
But as the following chart shows, in the same forty years, the United States has gone from a nation with balanced trade (imports roughly equal to exports) to a country that imports roughly fifty percent more than it exports, amassing a trade deficit in goods of more than $11.9 trillion since 1974 and with ongoing deficits in recent years being some $700 billion per year. Data used for the chart are contained in a table at the end of this write-up.
Bipartisan Administrations and majorities in the Congress have long perceived trade liberalization as the key to ensuring equal opportunities and reciprocal benefits for U.S. goods (and, in more recent years, services). However, the reality is that the past forty years have expanded trade but at the direct cost to Americans of millions of manufacturing jobs. Indeed, using U.S. Department of Commerce figures for jobs supported by exports in 2012 as a conservative estimate of lost jobs in the U.S. from imports that may be more labor intensive—5,359 jobs per $1 billion dollars of exported goods—the trade deficit in 2013 cost the United States over 3.75 million jobs in that year alone.[i] Applying the very conservative 5,359 jobs per $1 billion of exports to the accumulated trade deficit in goods since 1974—$11.947 trillion—suggests that the United States has lost more than 64 million employee years of work because of the trade deficit.
Can there be any doubt why those in the middle class that are unable to follow jobs being shipped overseas are so concerned with the direction of U.S. trade policy? Something is seriously amiss and has been for many years. Trade liberalization has brought expanded trade but not reciprocal opportunities. The problem is not owned by any political party—it has grown throughout the last forty years. One can certainly identify a range of factors that have contributed to the loss of jobs and the swollen deficit.
1. Energy imports and the distortions in global markets caused by the oil cartel have been one example. Since energy imports constitute the largest single category in our trade deficit with the world, finding a multilateral solution to the cartel problem has been and continues to be an unresolved problem. Recent oil and gas production in the United States has bolstered domestic production and is reducing the import reliance for the first time in many decades (the deficit in petrochemical products is down $53 billion in 2013 for the first 11 months. However, that deficit is still running at $230 billion for 2013 for the year).
2. The inability of the political parties to resolve the large distortions caused by the differential treatment of direct and indirect subsidies under GATT and now WTO rules places U.S. manufacturers and agricultural producers at severe disadvantages because of export subsidies, which are not addressable within the United States on imported product, and a double taxation on U.S. exports when entering the some 160 countries with indirect tax systems (e.g., value added tax). It affects service providers as well. This is an example of an issue that Congress has understood and has included in every fast track/trade promotion bill since 1974 and that the Johnson Administration worked hard to get addressed in the 1960s. The peculiar discrimination against U.S. companies and their workers from the inability of the United States to get trading partners to address the issue or of Congress to agree on an approach that would convert our tax structure to one that more closely resembles many of our trading partners seriously handicaps U.S. companies and their workers.
3. Market access commitments made by trading partners at the WTO and/or in FTAs should have improved reciprocity for U.S. companies and workers. However, the inability to obtain compliance with existing obligations has been a perennial problem for U.S. exports.
a. For example, Japan’s automobile market and barriers to participation in the motor vehicle and motor vehicle parts sector is as closed today in fact as it has been since the 1960s.
b. U.S. agriculture is blocked for many improper reasons around the world, whether in the EU, Asia, or elsewhere. China’s continued refusal to open its market to U.S. beef is one classic example.
c. Many academics and sectors of the U.S. economy have been complaining for years about currency manipulation that distorts trade by encouraging exports and limiting imports – Japan, Korea, and China have been frequently cited by the private sector as posing major concerns. For example, in a recent study, C. Fred Bergsten and Joseph Gagnon of the Institute for International Economics estimate that $200-500 billion of the U.S. current account deficit is caused by currency manipulation, most of that by China.
d. And the list of problems U.S. exporters and companies face with China not complying with its WTO commitments is stunning as the 2013 USTR report to Congress on China’s WTO Compliance (159 pages) reveals. The role of state-owned and state-invested enterprises, the interference with investment decisions through the requirements of technology transfer and local content requirements, the use of WTO-illegal export restraints, the retaliatory use of trade remedies by China—the list goes on and on. While U.S. exports to China have grown, the ratio of U.S. imports from China versus U.S. exports to China remains at 4 to 1, with China accounting for a huge part of our overall trade deficit—43.3% in 2012 (U.S. International Trade Commission website, total exports – U.S. general imports) and 46.2% in 2013 (1st eleven months). Every year that the United States is not able to get the benefit of the bargain from China’s accession our deficit grows. We are now running an annual deficit with China of more than $300 billion, meaning a loss of manufacturing jobs of more than 1.6 million.
So the problems are many and the current approach of a slightly modified trade promotion bill, which at least attempts to begin to address some issues (currency manipulation and state-owned enterprises for example) and provide some better Congressional oversight, is likely not sufficient to change the trajectory of our trading relationship with the world. That suggests that the Congress and the Administration need to use 2014 to in fact ensure that the path forward is not simply a continuation of the path on which we have been. We cannot continue to run trade deficits of $700-800 billion per year. Many of the issues that need to be addressed may be in the trade policy arena. Other issues that need to be addressed may be in the domestic policy arena to prevent the continued loss of jobs, businesses, and the tax base in communities across the country. But you cannot address the core problems if you are not open to an honest debate on what has and has not happened under the trade policy direction of the last four decades and what is actually needed to turn our trade policy into a reality of balanced opportunities for our companies and workers.
U.S. Trade in Goods – Balance of Payments (BOP) Basis vs. Census Basis
Value in Millions of Dollars
|
|
Balance |
Exports |
Imports |
|||
|
Period |
BOP Basis |
Census Basis |
BOP Basis |
Census Basis |
BOP Basis |
Census Basis |
|
1969 |
607 |
1,289 |
36,414 |
37,332 |
35,807 |
36,043 |
|
1970 |
2,603 |
3,224 |
42,469 |
43,176 |
39,866 |
39,952 |
|
1971 |
-2,260 |
-1,476 |
43,319 |
44,087 |
45,579 |
45,563 |
|
1972 |
-6,416 |
-5,729 |
49,381 |
49,854 |
55,797 |
55,583 |
|
Nixon |
-5,466 |
-2,692 |
171,583 |
174,449 |
177,049 |
177,141 |
|
1973 |
911 |
2,389 |
71,410 |
71,865 |
70,499 |
69,476 |
|
1974 |
-5,505 |
-3,884 |
98,306 |
99,437 |
103,811 |
103,321 |
|
1975 |
8,903 |
9,551 |
107,088 |
108,856 |
98,185 |
99,305 |
|
1976 |
-9,483 |
-7,820 |
114,745 |
116,794 |
124,228 |
124,614 |
|
Nixon/Ford |
-5,174 |
236 |
391,549 |
396,952 |
396,723 |
396,716 |
|
1977 |
-31,091 |
-28,352 |
120,816 |
123,182 |
151,907 |
151,534 |
|
1978 |
-33,927 |
-30,205 |
142,075 |
145,847 |
176,002 |
176,052 |
|
1979 |
-27,568 |
-23,922 |
184,439 |
186,363 |
212,007 |
210,285 |
|
1980 |
-25,500 |
-19,696 |
224,250 |
225,566 |
249,750 |
245,262 |
|
Carter |
-118,086 |
-102,175 |
671,580 |
680,958 |
789,666 |
783,133 |
|
1981 |
-28,023 |
-22,267 |
237,044 |
238,715 |
265,067 |
260,982 |
|
1982 |
-36,485 |
-27,510 |
211,157 |
216,442 |
247,642 |
243,952 |
|
1983 |
-67,102 |
-52,409 |
201,799 |
205,639 |
268,901 |
258,048 |
|
1984 |
-112,492 |
-106,702 |
219,926 |
223,976 |
332,418 |
330,678 |
|
Reagan |
-244,102 |
-208,888 |
869,926 |
884,772 |
1,114,028 |
1,093,660 |
|
1985 |
-122,173 |
-117,711 |
215,915 |
218,815 |
338,088 |
336,526 |
|
1986 |
-145,081 |
-138,279 |
223,344 |
227,159 |
368,425 |
365,438 |
|
1987 |
-159,557 |
-152,119 |
250,208 |
254,122 |
409,765 |
406,241 |
|
1988 |
-126,959 |
-118,526 |
320,230 |
322,426 |
447,189 |
440,952 |
|
Reagan |
-553,770 |
-526,635 |
1,009,697 |
1,022,522 |
1,563,467 |
1,549,157 |
|
1989 |
-117,749 |
-109,399 |
359,916 |
363,812 |
477,665 |
473,211 |
|
1990 |
-111,037 |
-101,719 |
387,401 |
393,592 |
498,438 |
495,311 |
|
1991 |
-76,937 |
-66,723 |
414,083 |
421,730 |
491,020 |
488,453 |
|
1992 |
-96,897 |
-84,501 |
439,631 |
448,164 |
536,528 |
532,665 |
|
Bush |
-402,620 |
-362,342 |
1,601,031 |
1,627,298 |
2,003,651 |
1,989,640 |
|
1993 |
-132,451 |
-115,568 |
456,943 |
465,091 |
589,394 |
580,659 |
|
1994 |
-165,831 |
-150,630 |
502,859 |
512,626 |
668,690 |
663,256 |
|
1995 |
-174,170 |
-158,801 |
575,204 |
584,742 |
749,374 |
743,543 |
|
1996 |
-191,000 |
-170,214 |
612,113 |
625,075 |
803,113 |
795,289 |
|
Clinton |
-663,452 |
-595,213 |
2,147,119 |
2,187,534 |
2,810,571 |
2,782,747 |
|
1997 |
-198,428 |
-180,522 |
678,366 |
689,182 |
876,794 |
869,704 |
|
1998 |
-248,221 |
-229,758 |
670,416 |
682,138 |
918,637 |
911,896 |
|
1999 |
-337,374 |
-328,821 |
698,218 |
695,797 |
1,035,592 |
1,024,618 |
|
2000 |
-446,942 |
-436,104 |
784,781 |
781,918 |
1,231,722 |
1,218,022 |
|
Clinton |
-1,230,965 |
-1,175,205 |
2,831,781 |
2,849,035 |
4,062,745 |
4,024,240 |
|
2001 |
-422,512 |
-411,899 |
731,189 |
729,100 |
1,153,701 |
1,140,999 |
|
2002 |
-475,842 |
-468,263 |
697,439 |
693,103 |
1,173,281 |
1,161,366 |
|
2003 |
-542,273 |
-532,350 |
729,816 |
724,771 |
1,272,089 |
1,257,121 |
|
2004 |
-666,364 |
-654,830 |
821,986 |
814,875 |
1,488,349 |
1,469,704 |
|
Bush |
-2,106,991 |
-2,067,342 |
2,980,430 |
2,961,849 |
5,087,420 |
5,029,190 |
|
2005 |
-784,133 |
-772,373 |
911,686 |
901,082 |
1,695,820 |
1,673,455 |
|
2006 |
-838,788 |
-827,971 |
1,039,406 |
1,025,967 |
1,878,194 |
1,853,938 |
|
2007 |
-822,743 |
-808,763 |
1,163,605 |
1,148,199 |
1,986,347 |
1,956,962 |
|
2008 |
-833,957 |
-816,199 |
1,307,329 |
1,287,442 |
2,141,287 |
2,103,641 |
|
Bush |
-3,279,621 |
-3,225,306 |
4,422,026 |
4,362,690 |
7,701,648 |
7,587,996 |
|
2009 |
-510,550 |
-503,582 |
1,069,475 |
1,056,043 |
1,580,025 |
1,559,625 |
|
2010 |
-650,156 |
-635,362 |
1,288,795 |
1,278,495 |
1,938,950 |
1,913,857 |
|
2011 |
-744,139 |
-727,765 |
1,495,853 |
1,480,290 |
2,239,991 |
2,208,055 |
|
2012 |
-741,475 |
-729,611 |
1,561,239 |
1,545,709 |
2,302,714 |
2,275,320 |
|
Obama |
-2,646,320 |
-2,596,320 |
5,415,362 |
5,360,537 |
8,061,680 |
7,956,857 |
|
2013 |
-700,625 |
-743,444 |
1,595,562 |
1,579,690 |
2,291,145 |
2,265,428 |
|
Totals |
-11,957,192 |
-11,605,326 |
24,107,646 |
24,088,286 |
36,059,793 |
35,635,905 |
|
1975-2013 |
-11,947,132 |
-11,601,139 |
23,766,347 |
23,742,535 |
35,708,434 |
35,285,967 |
Source: U.S. Department of Commerce’s Bureau of Economic Analysis. 2013 data annualized based on January – November data.
[i] Martin Johnson & Chris Rasmussen, U.S. Department of Commerce, Jobs Supported by Exports 2012: An Update (Feb. 26, 2013).
For more information about the Washington DC based, Law Offices of Stewart and Stwewart, please visit the International Society of Primerus Law Firms.